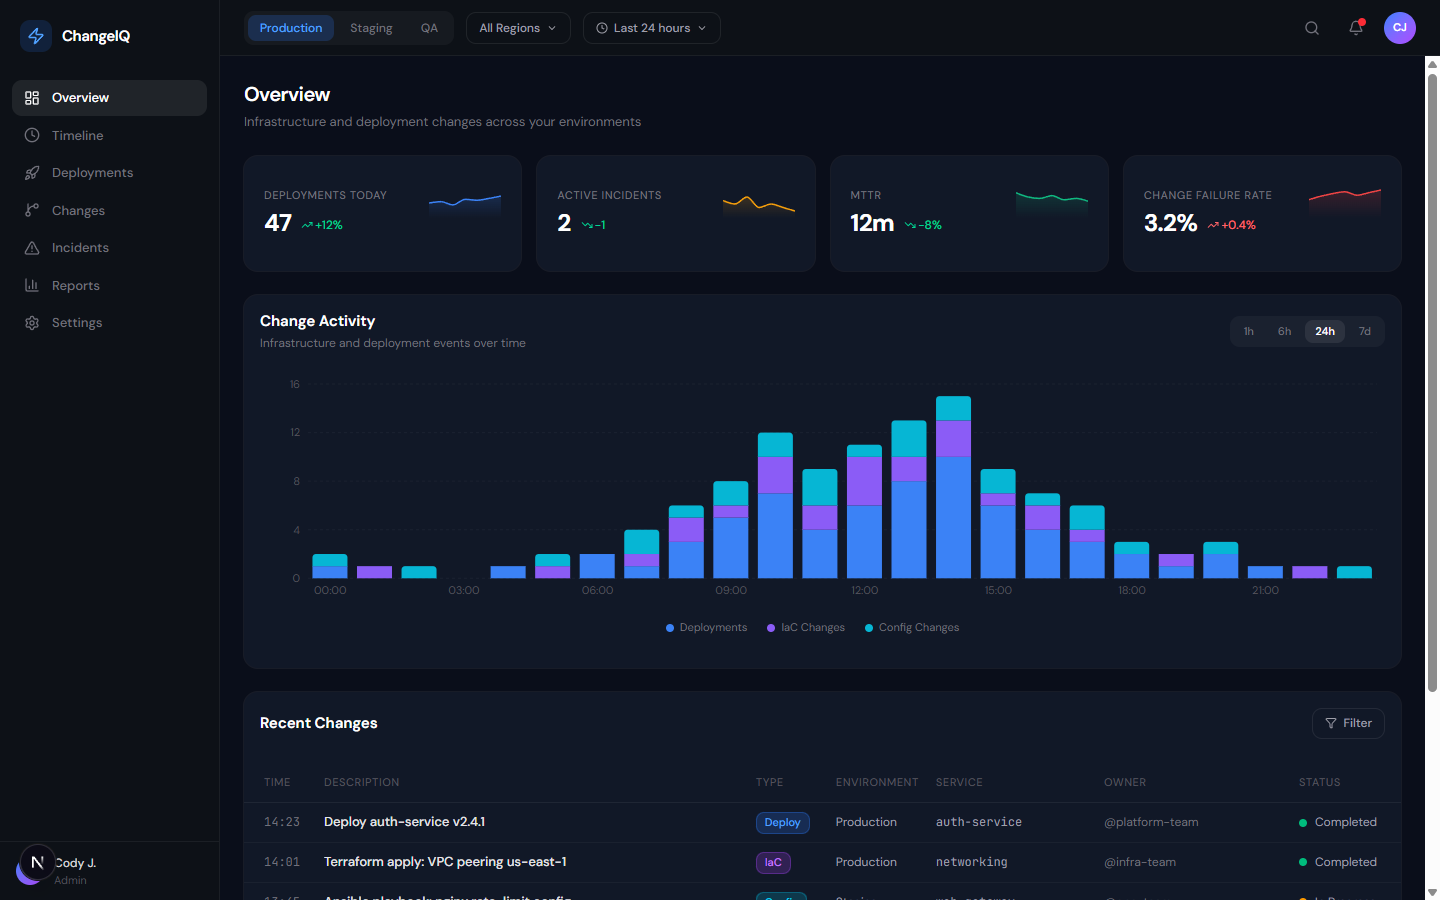
When an incident hits, your team wastes 40% of response time manually checking GitHub Actions, Terraform logs, and cloud consoles for what changed. ChangeIQ captures every CI/CD deployment, IaC apply, and manual config change in one searchable timeline — so you find the root cause in seconds, not hours.
One timeline across your entire change surface
When a production alert fires at 2am, your team splits up and starts digging — one engineer checks GitHub Actions, another opens Terraform Cloud, a third scrolls through AWS CloudTrail, and someone else starts an archaeology expedition through Slack. Forty minutes later, you find a config change applied six hours ago.
This isn't a people problem. It's a tooling gap. CI/CD pipelines only record changes they made. Monitoring tools capture metrics and traces, not deployments. IaC history lives in Terraform Cloud. Cloud audit logs are buried across three separate consoles. No single tool owns the complete change record — so nobody has it.
ChangeIQ closes that gap. Every deployment, infrastructure apply, Kubernetes event, and manual config change flows into one searchable timeline — so when an incident fires, the answer is one query away, not forty minutes of Slack archaeology.
40%
of incident response time spent on change archaeology
5+
separate tools the average SRE checks manually during an incident
<2m
to find root cause with a unified change timeline
0
changes to your existing pipeline tooling required
CI/CD deployments, Terraform applies, Kubernetes events, manual config changes — ChangeIQ is the first tool that captures all of them in one searchable timeline.
Every deployment, Terraform apply, Ansible run, and config change in one chronological feed. Instantly correlate changes with incidents.
Drop a single API call into your CI/CD pipeline to record every deployment with precise start and stop timestamps. Works with any pipeline tool.
Native support for Terraform, Ansible, Puppet, and Kubernetes. Track infrastructure-as-code changes alongside deployments automatically.
Deployment frequency, lead time, MTTR, and change failure rate — calculated automatically. Generate executive summaries in one click.
Enrich change records with custom fields, team tags, and smart labels. Filter and search by any dimension that matters to your team.
Go beyond pipelines. Ingest change data from infrastructure logs, webhooks, and any custom source for complete visibility.
ChangeIQ fits into the workflows of the people who feel the cost of slow incident response most directly.
You're responsible for the reliability of systems you didn't build, using tools you didn't choose. ChangeIQ gives you a complete audit trail across every team's deployments and infrastructure changes — without asking anyone to change their workflow.
When you're running an incident bridge, you need fast answers to "what changed in the last 2 hours?" — not three engineers digging through separate tool logs while customers are down. ChangeIQ gives you the change context to make faster decisions and communicate clearly with stakeholders.
DORA metrics — deployment frequency, lead time, MTTR, change failure rate — are the language of engineering health. ChangeIQ calculates them automatically from real pipeline data, so you can report on reliability improvements without manual spreadsheets or guesswork.
You build the internal platforms that product teams deploy through. ChangeIQ sits at the intersection of every pipeline, IaC tool, and config system you manage — giving you unified visibility into the change surface your platform owns.
Add a single API call to your CI/CD pipeline, or connect your IaC tools. Setup takes less than 5 minutes.
Every deployment, config change, and infrastructure update is captured and indexed automatically in real time.
When an incident hits, filter by time window, environment, service, or team. What used to take 40 minutes of Slack archaeology takes seconds.
Your existing stack covers metrics, incidents, and logs as first-class data. Change is the one signal type that still gets treated as an afterthought — a side-effect buried inside other tools.
Logs describe what running processes did — not what was intentionally changed. A deploy log entry looks almost identical to a restart log entry. A Terraform apply is buried inside hundreds of lines of plan output. Cloud audit entries are scattered across three separate consoles, each with its own schema.
ChangeIQ treats every deployment, IaC apply, and config change as an explicit, structured event — with a name, a service, an environment, a source, and start/stop timestamps. Filtering "what changed in production in the last 2 hours?" returns the changes themselves, not a haystack of log lines to pattern-match against.
| Capability | Datadog Events | PagerDuty Change Events | Raw Logs (ELK / Splunk) | ChangeIQ |
|---|---|---|---|---|
| Explicit, structured change events | Yes | Yes | Requires parsing | Yes |
| Native Terraform / Ansible / Puppet parsing | Manual via SDK | Manual via SDK | — | Native |
| Unified timeline: CI/CD + IaC + cloud + config | Partial (events stream) | Partial (change feed) | DIY build-out | Core feature |
| DORA metrics auto-calculated | Via CI Visibility add-on | — | — | All four, built-in |
| Primary product focus | Observability / APM | Incident management | Log search | Change intelligence |
| Cost at mid-market scale | $$$$ | $$$ | $$$ (self-hosted+) | Early access: free |
ChangeIQ isn't a replacement for your observability or incident tools — it's the layer that treats change events the way Datadog treats metrics and PagerDuty treats incidents: as a first-class, queryable, correlatable data type.
ChangeIQ is in private early access. Join the waitlist and we'll send you an invite — along with a setup guide to get your first change timeline running in under 5 minutes.